Welcome!
Site credits, and ways to contact us, are linked below in the page footer area.
Please let us know if you would like to help populate YSOC!
You have already found your way to the "Tutorials" link from the page header area.
Next to this is the "Tables and Columns" link, which identifies all of the tracked data
in the YSOC database.
These are the columns that are available as variables for search query and search return,
plus interactive plotting.
It is good to get to know how we have labelled your favorite stellar properties,
in order to make the best use of YSOC.
The "References" link shows all primary sources of data in the YSOC database.
The right side of the page header is an area for accounts, with a Sign-up / Sign-in invitation.
The rest of this Tutorial page walks through the different ways to access and view YSOC content.
See the Table of Contents to right, or just scroll down.
To use the YSOC database, one specifies the criteria for a Search, and elements of the search Return.
Search/Return Area

See the Search Options sub-sections below for detailed explanation of the possibilities in the various "Search by" tabs.
Searches in YSOC can be performed by:
- specifying a particular Object/s
- requesting only the suspected members of a particular stellar Association
- asking whether the database has Data Availability for certain columns
- running a Query on Data Values using specific database columns.
The specified search parameters are cumulative in the different tabs.
Numerical counters indicate how many criteria are specified within each tab.
The red "Clear Search Form" button in the upper right clears all entries in all tabs.
See the Search Return section below for detailed explanation of the possibilities in the gray "Search Return" area.
YSOC can return specific database columns which are displayed and then available for interactive plotting.
It is also possible to run direct SQL queries on YSOC, with the correct database privileges. Contact us!
Search Options
Search by Object
If you have a specific object or set of objects in mind, this is the area for you.
You can query YSOC for an object name, or by a coordinate or list of coordinates.
You can also do an area search by specifying a cone around an object name or coordinate.
- Object Name

An Object/Name search must use a name that is recognizable by SIMBAD.
Under the hood, what is going on here is a query to SIMBAD that returns a coordinate,
and that coordinate is then used to search YSOC.
- Object Coordinate

An Object/Single Coordinate search can take either decimal or sexagesimal coordinate formats.
- Multiple Coordinates

An Object/Multiple Coordinates search similarly can take either decimal or sexagesimal coordinate formats.
The method is a text file upload.
To ingest the file, we use the default read function of astropy.io.ascii.
If there is a header (indicated by # in the first column) we look for the first row containing 'ra' and 'dec'.
These must be lowercase and use the same delimiter as the rows, except for a special case with pipes.
See the example files decimal.txt and sexeges1.txt in the first case, and sexeges2.txt for the pipe-separated version.
Search by Association
We have organized the database by stellar associations, divided into categories of:
Star Forming Regions, Young Moving Groups, Open Clusters, and Other (Unassociated).
You can jump between categories using the blue tabs towards the left.
Clicking on an association takes you to the cluster_details page which provides information
on the individual star forming region, moving group, or open cluster,
as well as a listing of all of the stars in YSOC that are associated with the particular region.

Checking a box will include all suspected or potential members of the association in the search. Note that these selections do not guarantee physical membership of the returned stars in the named association, only that the star has appeared in the literature in the context of a study of the association or region. In order to selection on membership, use the Query on Data Values tab to specify a membership criterion, or simply be mindful of the "mem_num" values in the query return.
Clicking the red x will remove the region from the search.
Darker shading indicates the region or association is well-populated in YSOC.
Lighter shading indicates the region is on our minds, but has not
yet received the attention it deserves!
You can also filter for any particular association name you have in mind, rather than having to find it in the hierarchy. Note that you may have to swich among the blue tabs (Star Forming Regions, young Moving Groups, Open Clusters, and Other.} to find what you are looking for.
- Star Forming Regions
The Star Forming Regions section has been our main focus, with molecular clouds and their associated stellar populations hierarchically grouped.
- Moving Groups
The Moving Groups do not have any hierarchical structure.
- Open Clusters
We include a few benchmark Open Clusters in YSOC, which are generally older than the star forming regions, but serve as valuable calibrator populations.
- Other
The Other area of associations includes both known field stars and stars whose membership in any particular region is unknown, or at least unspecified within YSOC.
Search Data Availablity
Here one can restrict the search to only stars with (or without) specific kinds of data ingested in YSOC.
You can either type column names if you know them, or click among the options.
Use the x's in the yellow boxes to remove columns, or the "Clear Columns" button to the right to clear all.
The blue tabs towards the left let you jump between selecting for Populated and Unpopulated columns.
The search will return only stars meeting the criteria, and the selected columns are also added to the return display.

- Populated Columns
The search will return only stars with all of the named columns populated.
In the example above, both the single column 'pm_ra' and the entire table 'BinData' were clicked,
meaning that all five of the specified columns are required to be populated in order to return any particular star.
(Note that the set of objects with such exhaustive characterization of binary parameters is small, at present.)
- Unpopulated Columns
The analogous possibility exists to specify unpopulated columns. The search will return only stars with all of the named columns lacking data in YSOC.
A use case here might be, for example, to search for all stars with
effective temperatures (Teff or log_Teff)
and luminosities (L_star or log_L_star)
using the "Populated Columns" area,
but no lithium measurements (LiI_6708), specifying this in "Unpopulated Columns".
If you have an observing run coming up, you can make the above specifications on Populated and Unpopulated to choose only stars with good HR diagram locations but lacking lithium measurements, and then additionally use the "Query on Data Values" tab (discussed next) to further specify e.g. the RA range that is available on your telescope night. You could add in any other desired search criteria, such as on the value of Teff, for example returning only sources between 2000-3000 K.
Search Query on Data Values
There is a lot of data mining power in searches for stars meeting specific criteria.
Multiple requirements can be specified, with the search cumulative, that is, employing AND logic.
Also remember that the returned stars meet all specified criteria, in all tabs,
not just here in Data Value Queries.

The example box to the left shows the format of various kinds of queries.
Any YSOC column listed in Tables and Columns is available to be part of a query.
Both single parameter queries and those employing simple math, including inequalities/equality and e.g. photometric colors, are possible.
The green "Add Row" box will add a new query line, and the red "Remove" box will delete the query line if you have changed your mind.
Return Options
The gray bar area is where you can customize the Search Return.
The big blue "Search" button to the right executes the search.

Columns to Display and Plot
You can enter any number of database columns for display and plotting.
If columns have been specified in any of the Data Availability or Data Value Query tabs,
they will automatically appear here as well.
Any columns you don't want can be removed with the x.
Display Column Errors
This toggles whether the errors on each column are displayed or not.
In order to make plots with error bars, this box must be checked.
Use Sexagesimal RA/Dec
This toggles whether the coordinate format is decimal (default) or sexagesimal.
Show N Rows
This box specifies the maximum number of rows (indivisual stars) to return. You may wish to keep this small until you have defined the search to your satisfaction.
Results
YSOC search Results come as a table, below which is an interactive plot.
The default return is the YSOC database name, the object coordinates, a column indicating knowledge about membership, and the Association within YSOC. This is narrowest region with which the star has been identified in the literature, but it may have other associations in the hierarchy; see the relevant individual star (star_details) page.
Use the Columns to Display & Plot box in the Return Options area to add more columns to your results.
Table

For a large number of return rows, there will be a vertical scroll bar at the right of the table.
For a large number of return columns, there will be a horizontal scroll bar at the bottom of the table.
The returned table can be sorted by any column, in both increasing and decreasing order.
The table can be downloaded using the boxes in the upper right, in either .json or .csv format.
Clicking on a particular row under Star Name produces a new individual star (star_detail) page, containing a listing of all the associations, alternate names, and data details for that star. There are also various useful links at the top enabling you to access: the spectral energy distribution, images at different wavelengths, literature information via SIMBAD, other primary data via Vizier, and links to lightcurve data.
Plots

The default plot that comes with any successful query is of the sky positions Dec vs RA.
The plot is interactive, with available actions in the upper right plot.ly icons (not visible in the example above). Clicking on a point, or lassoing a group of points, will highlight those rows in the table above. The plot can be removed by clicking the x within the red box.
Plot Options

Any column that was returned in the search is available for plotting. In addition, simple math operations are possible. Specify the plot axes, then click the yellow "Add Plot". Any number of plots can be added.
To the left, click to Invert the axis scale, convert between Log and Linear scaling, or toggle the Error bars.
Errors are available only if you have selected the Display Column Errors option in the gray search Return area.
To the right, use the black "List" / "Grid" toggle to reformat the plot layout. The red "Remove All" clears the plot area. The blue "Clear Highlight" removes the blue highlighting in the table of the selected data points.
Plot with Errors

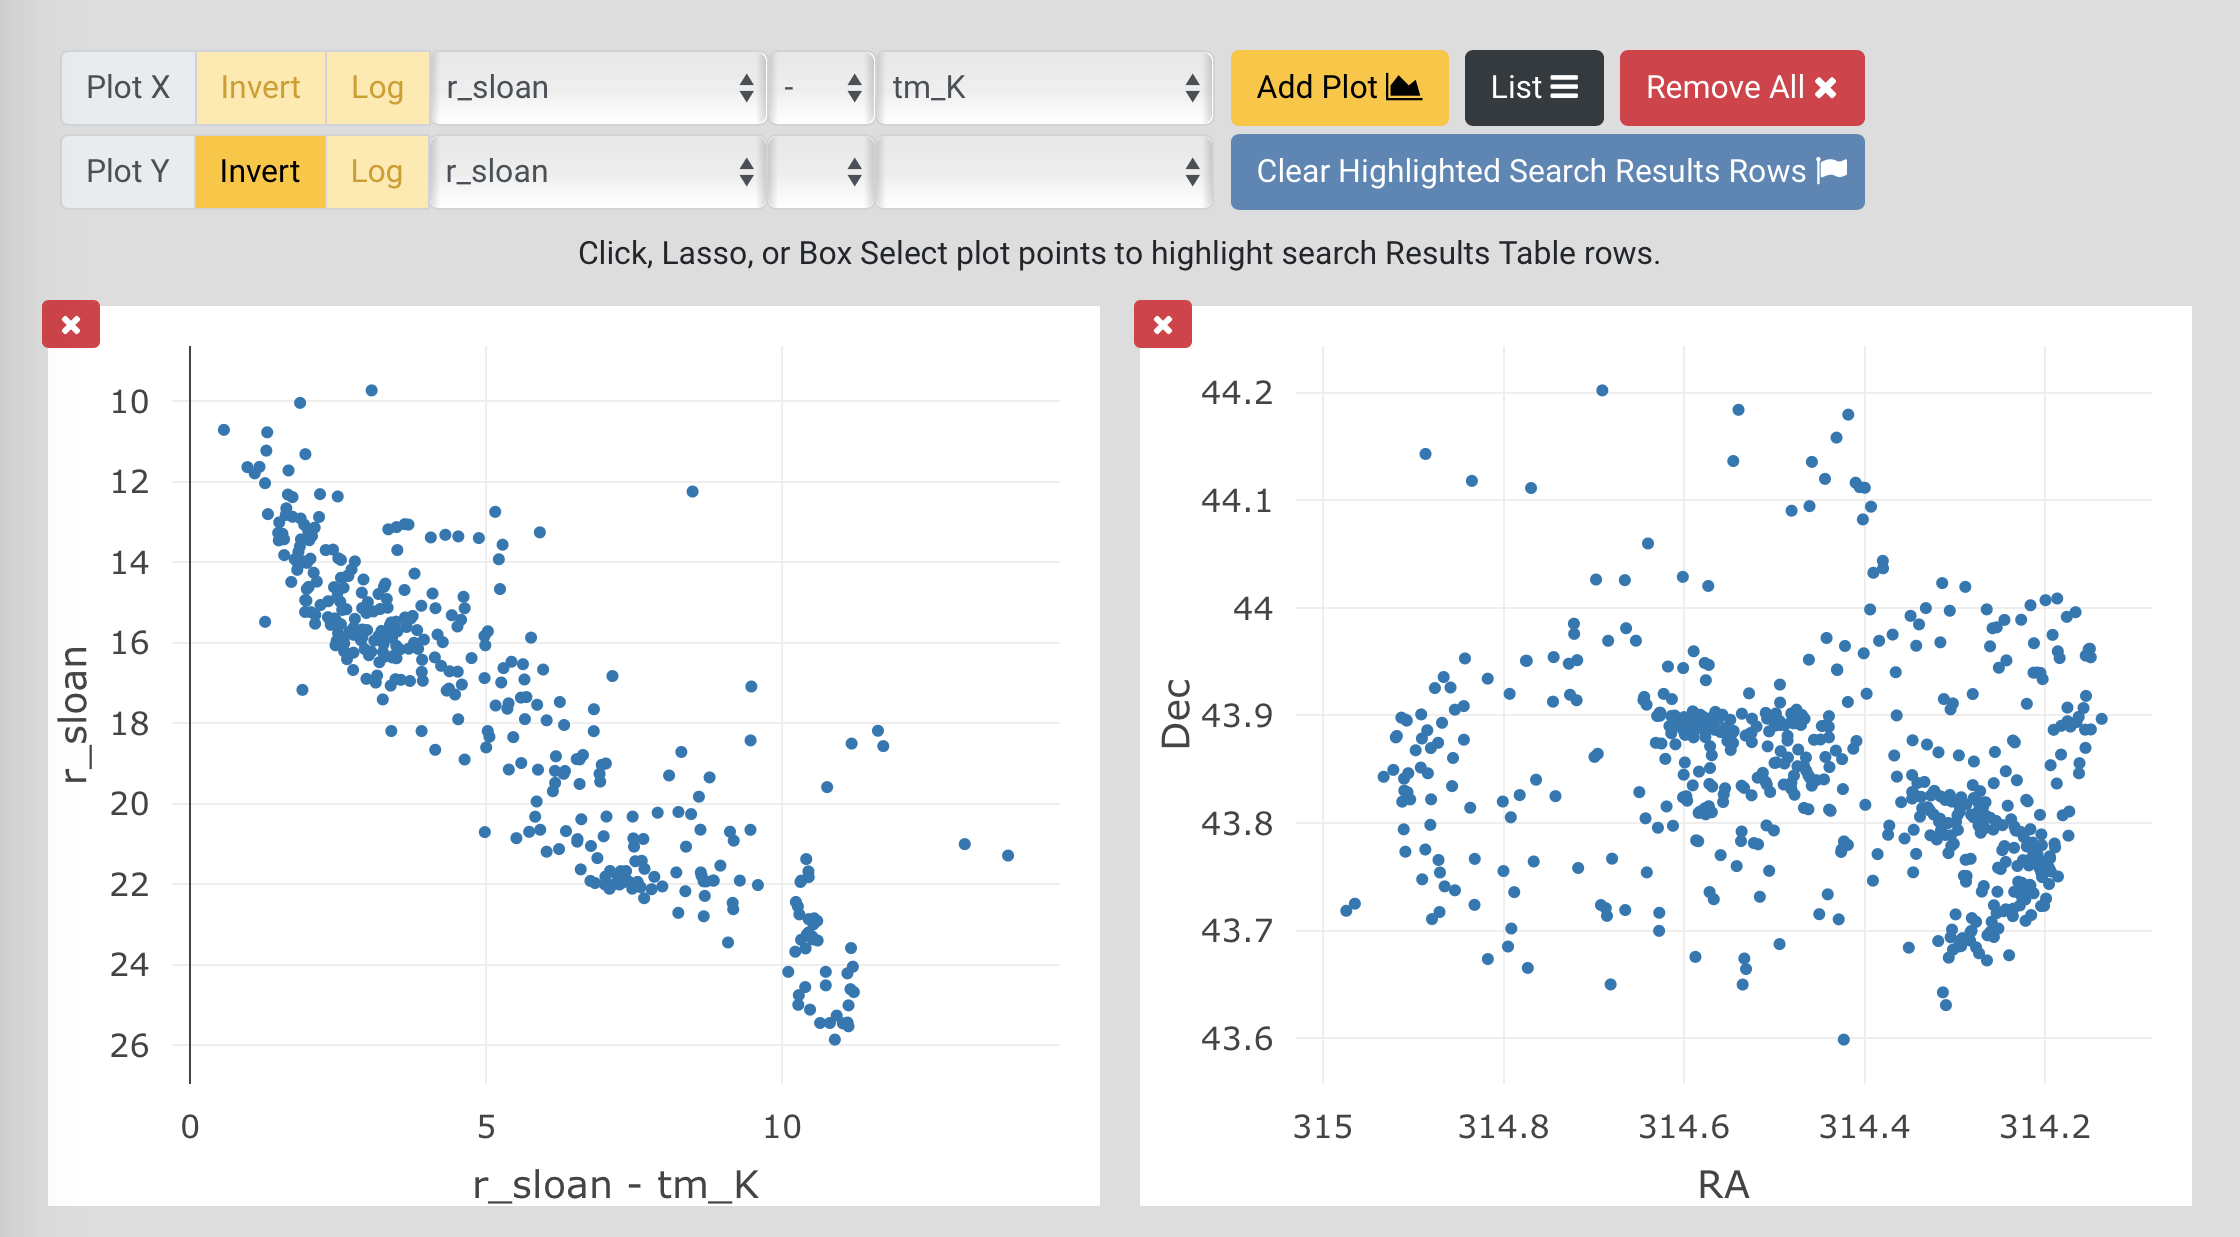
The figure above illustrates the addition of a second plot, a color-color diagram, which has been displayed with errors.
Again note that, in order to plot errors, the Display Column Errors box must be checked in the gray Return Options area.
Plot Histograms
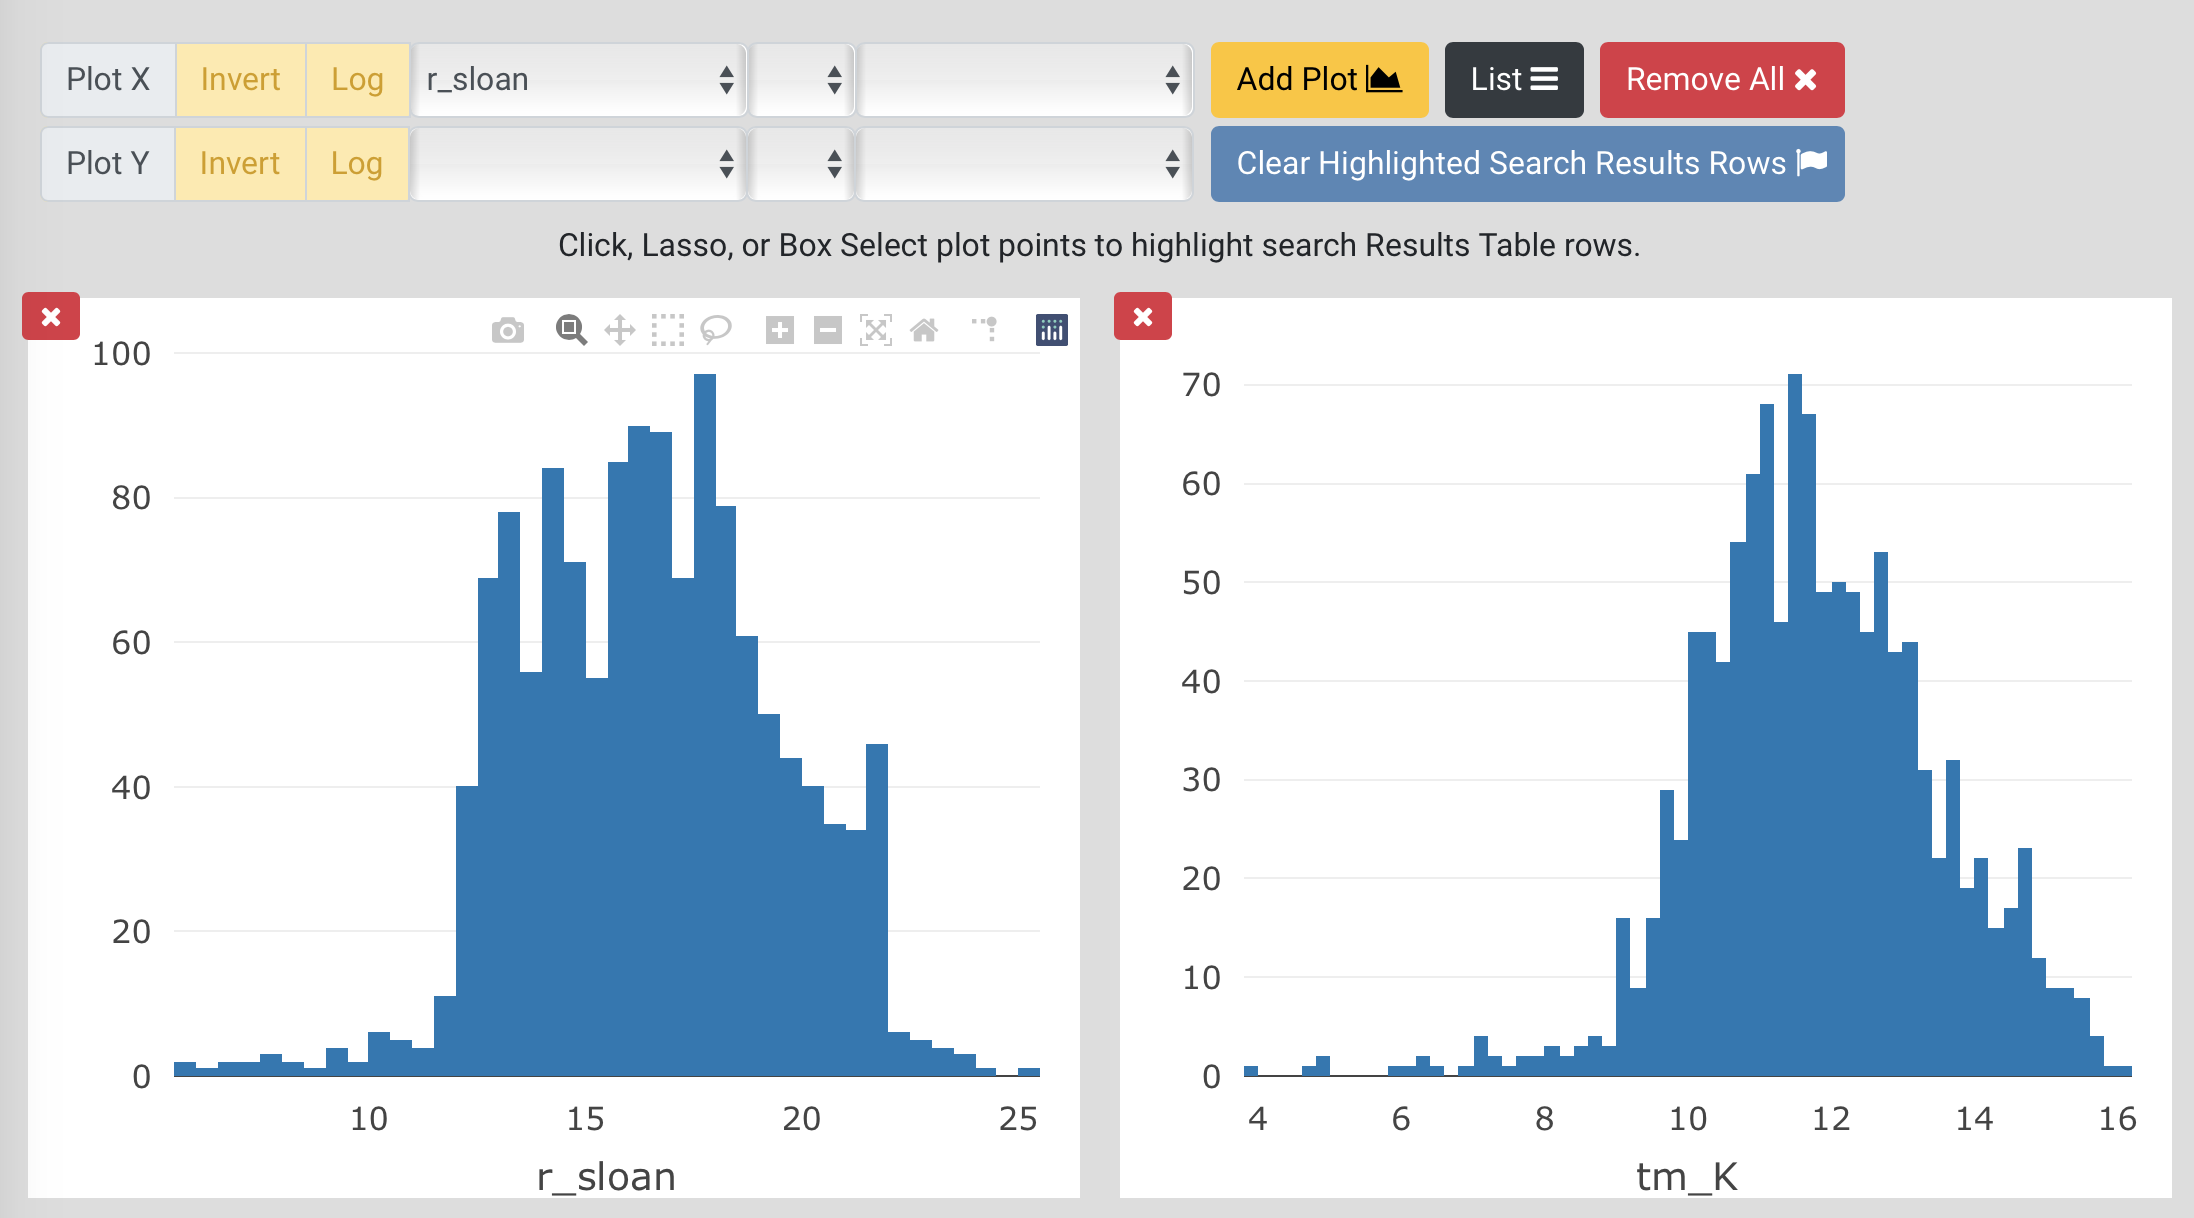
Lorum ipsum for Histogram plot output...
An Example of YSOC Query/Return
Below is an example query.
We have set up a search for all YSOC content within 20' of the young star LkHa 188.
This star is located in the dark cloud associated with the North America / Pelican Nebulae region.
The columns to be returned are the r-band and K-band photometry, in addition to the default columns.

Here is the first several lines of tabular return, with links to the individual star pages.

Here is some plotted output. In addition to the default Declination vs Right Ascension plot, we have requested an r vs r-K color-magnitude diagram.
YSOC Tables & Columns Page
The Tables & Columns page specifies the database names for various astronomical quantities.
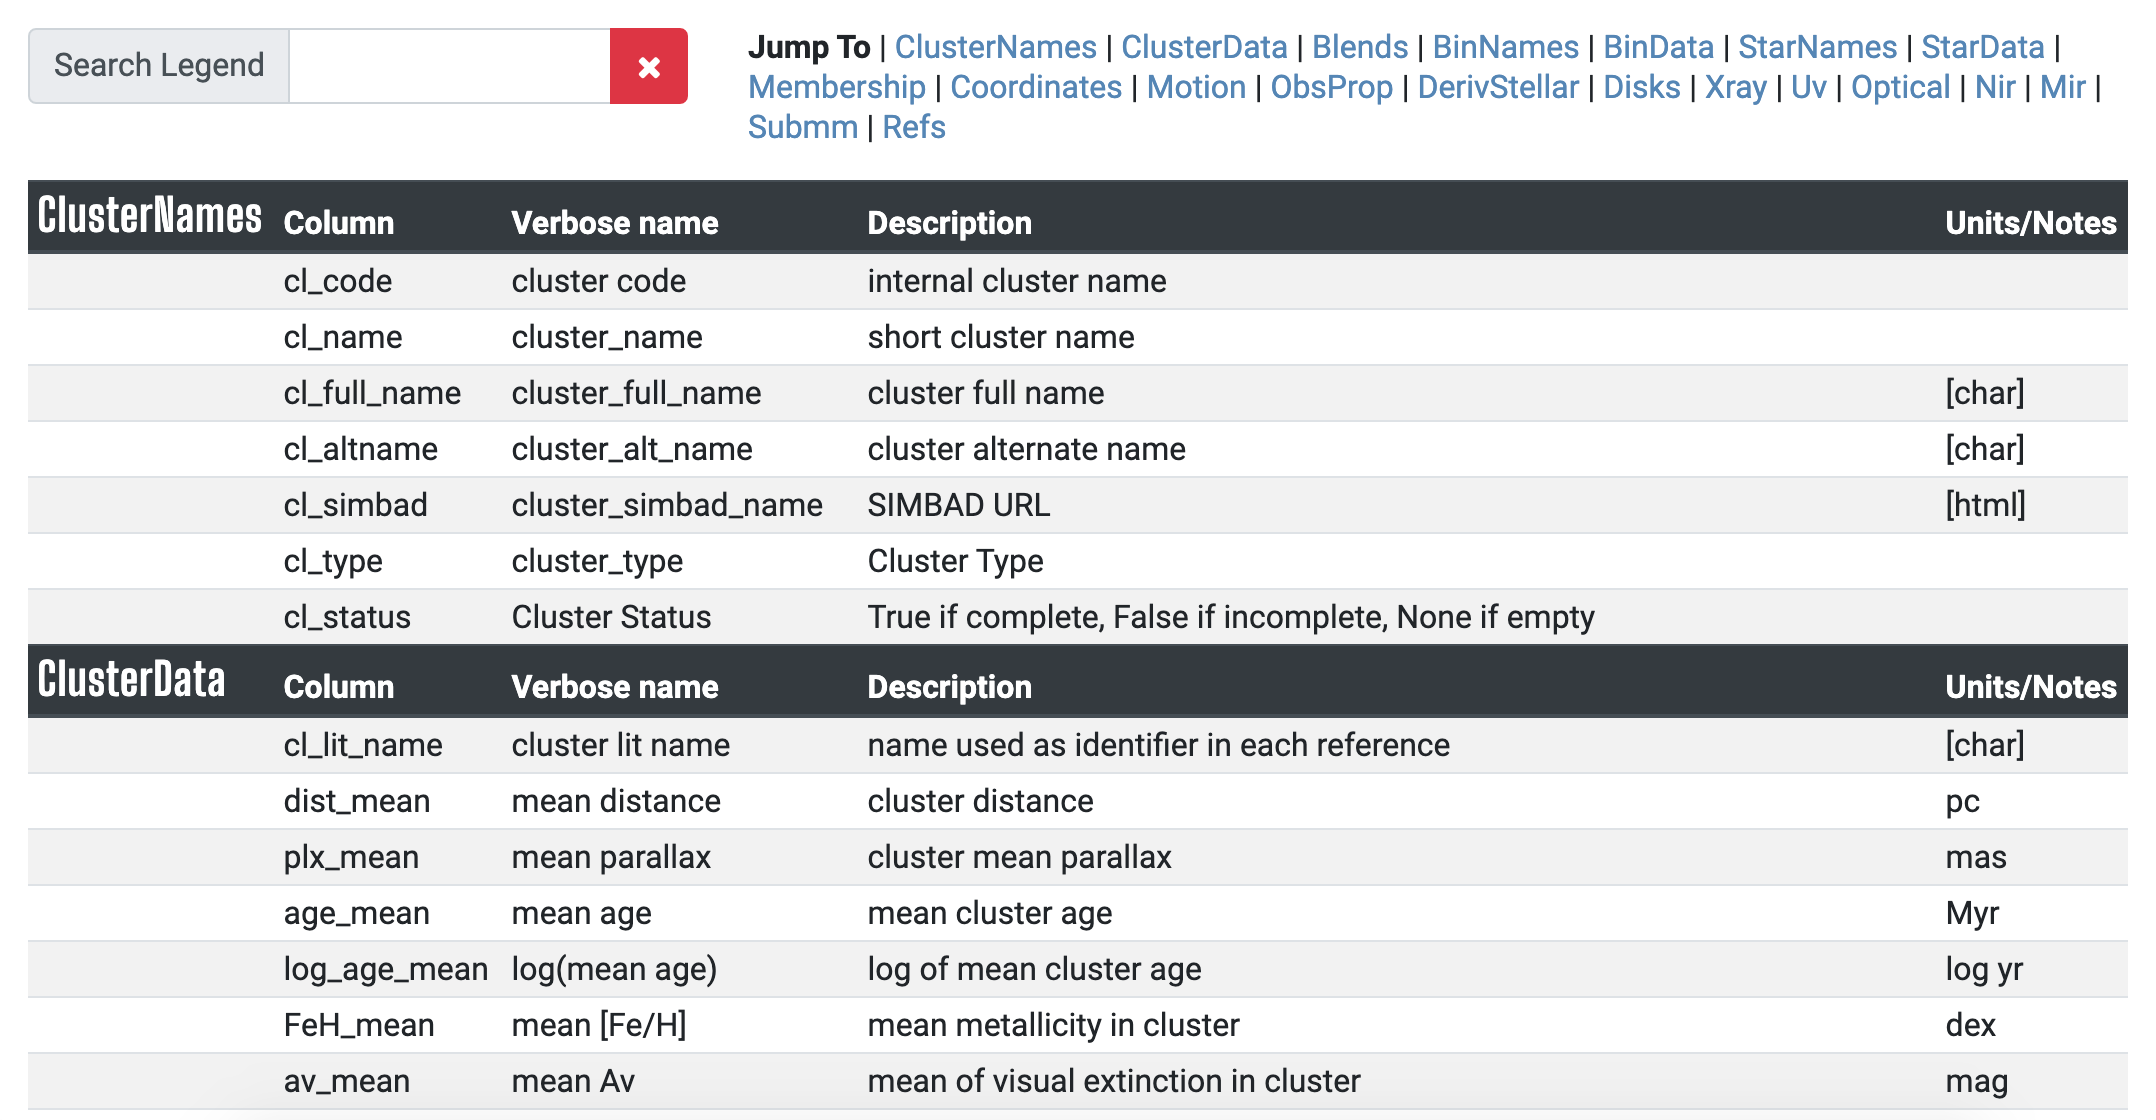
The variables listed under the Columns column can be used in YSOC search and return syntax.
If you seek particular information, use the box at the top to filter the list and learn how we have designated your favorite mesurement or derived quantity for young stars.
References Page
References displays all the primary sources of data in the YSOC database, as well as many papers with data that we have downloaded, but not yet organized and uploaded into YSOC.
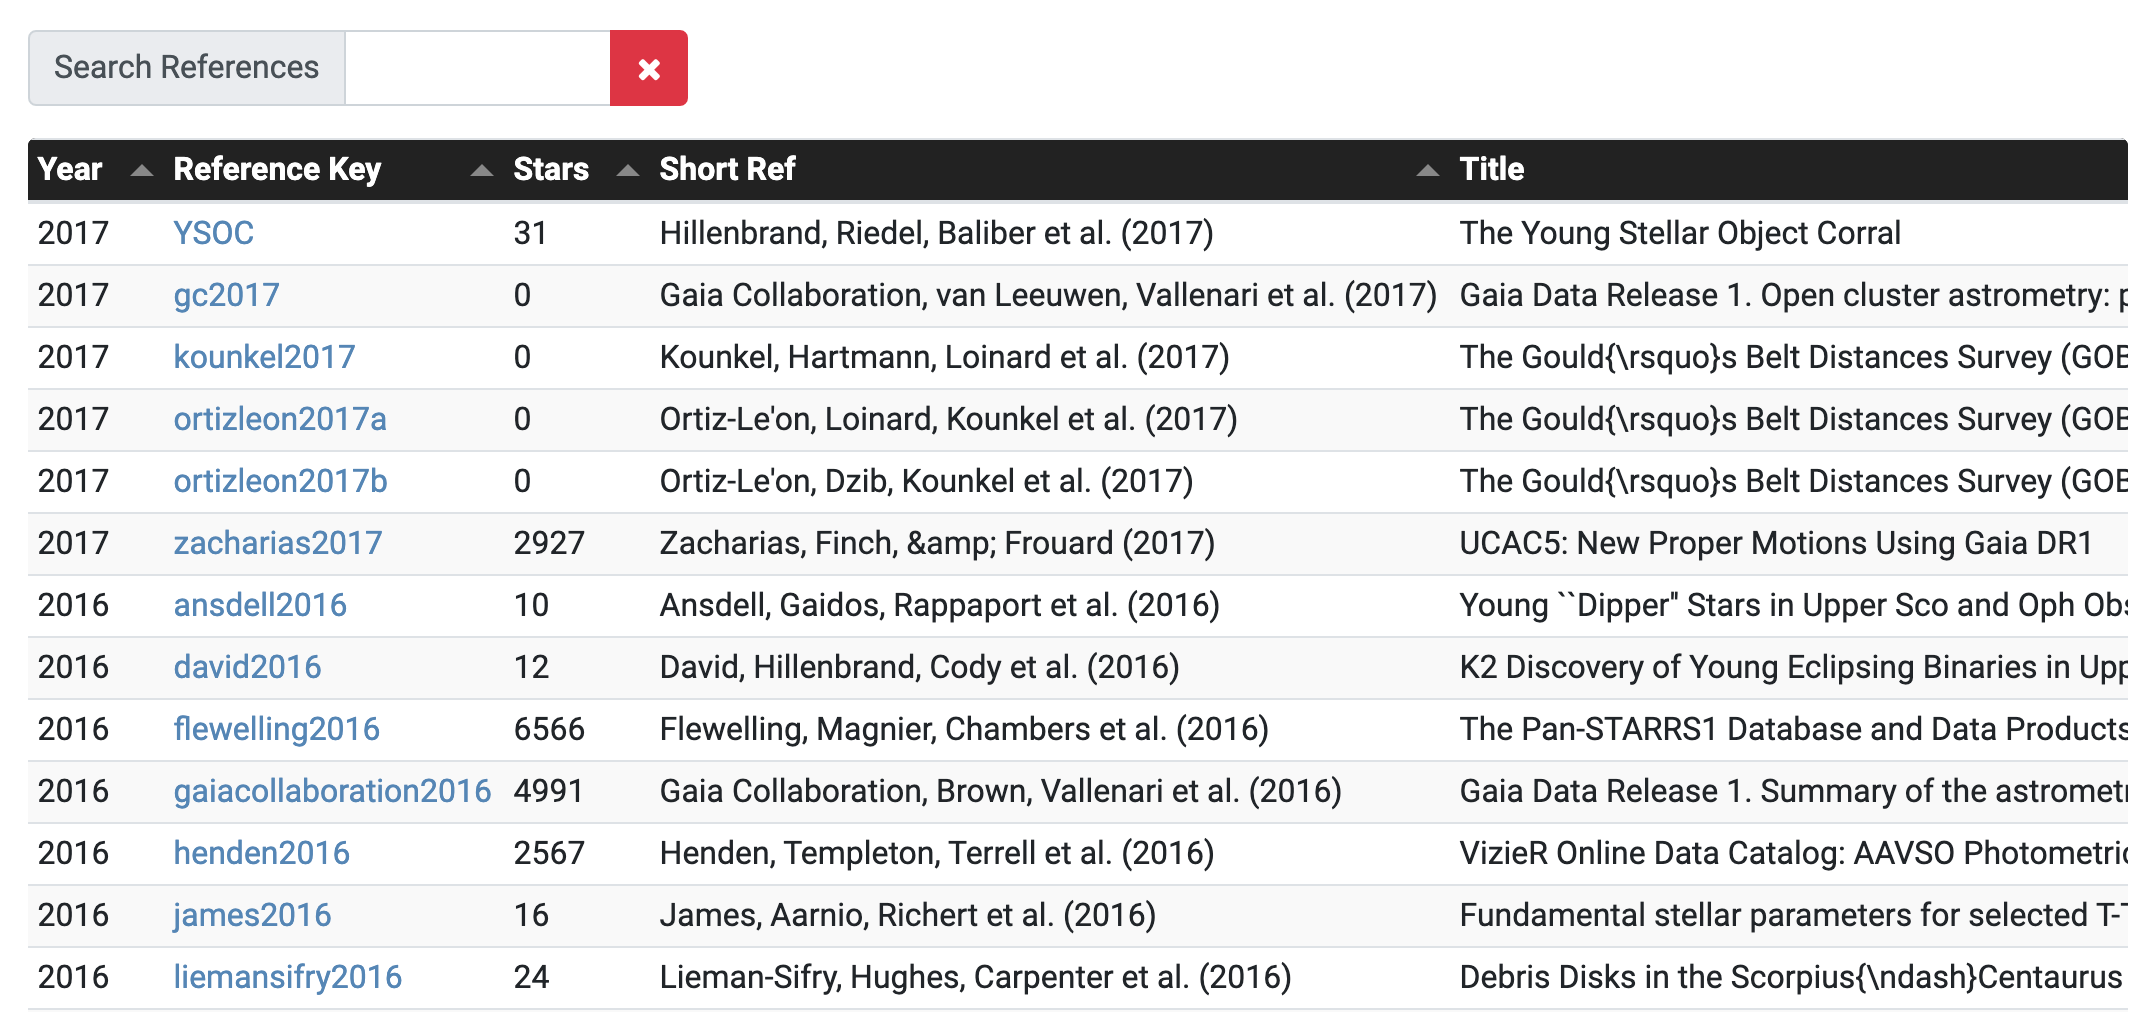
The default sorting is inverse by year (most recent papers first) but all columns are
sortable.
The references list can also be filtered to readily find papers by certain authors or with specific title content.
Links take you to pages with the YSOC stars associated with the paper, as well as to the full bibliographic information.
The Stars column indicates how many individual stars YSOC contains that have data from this paper.
Note that there are many references with 0 in the Stars column, but that may serve as references
for information on the individual clusters (cluster_details) pages.
These are linked e.g. from the Associations tabs, but also from the individual stars (star_details) pages.
Star Page
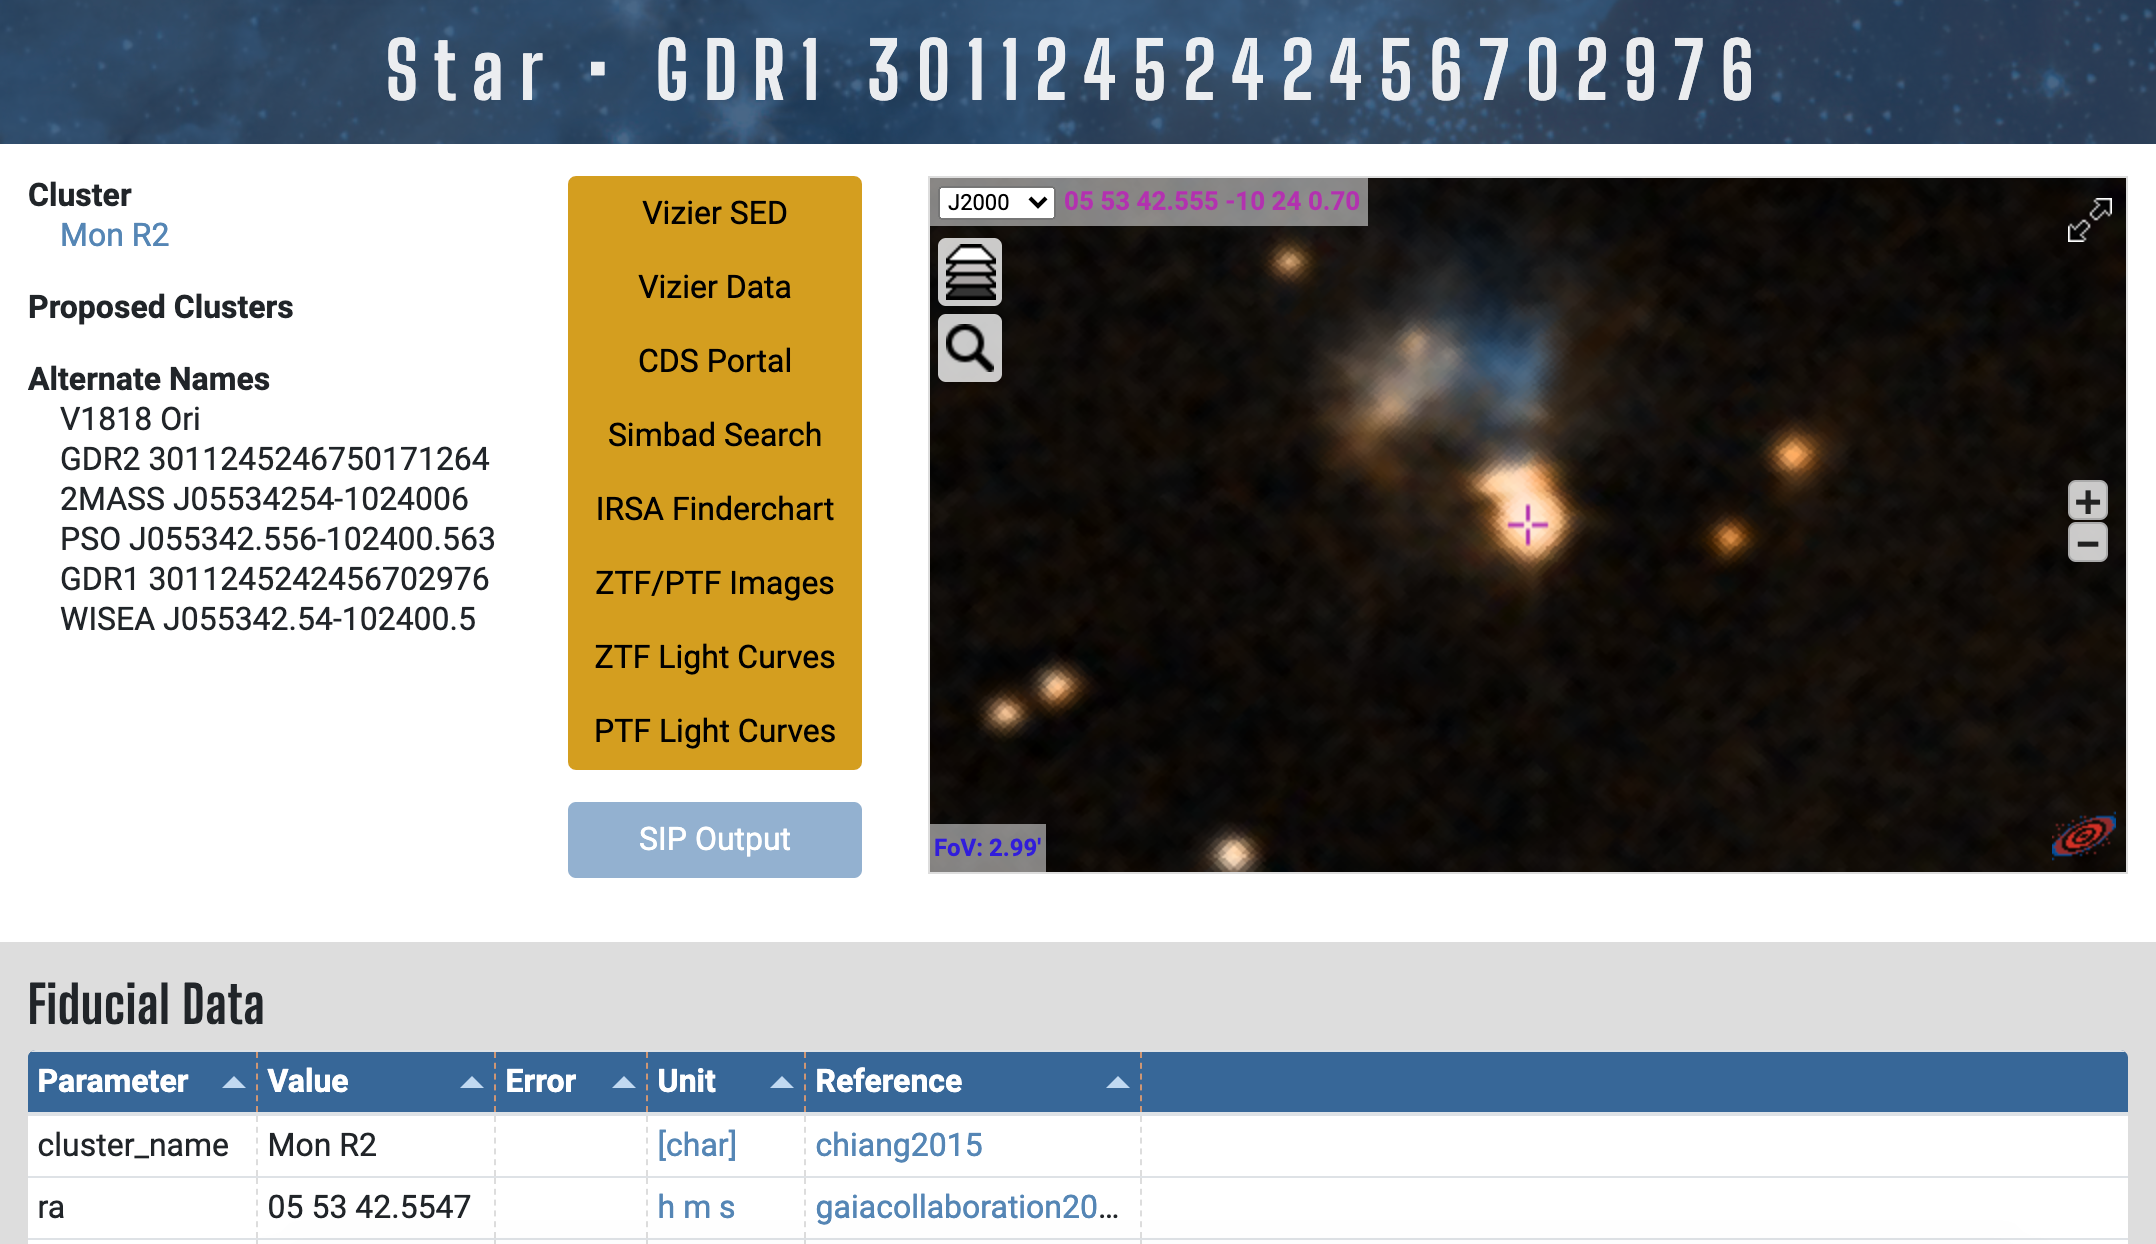
This is an example of an individual star page, with links in the top section to
YSOC content on the parent cluster (MonR2 in this case),
various external databases/resources, and Aladdin multi-wavelength image services.
Additional sections provide Fiducial Data (one value per YSOC column
that we have determined is ``the best")
as well as Nonfiducial Data, essentially all other collected literature values.
Cluster Page
This is an example of an individual cluster page with links in the top section YSOC content on any parent cluster.
As for the individual stars pages, the individual clusters pages have additional sections providing Fiducial Data (one value per YSOC cluster column that we have determined is ``the best") as well as all collected literature values
